Flagship Programmes
|
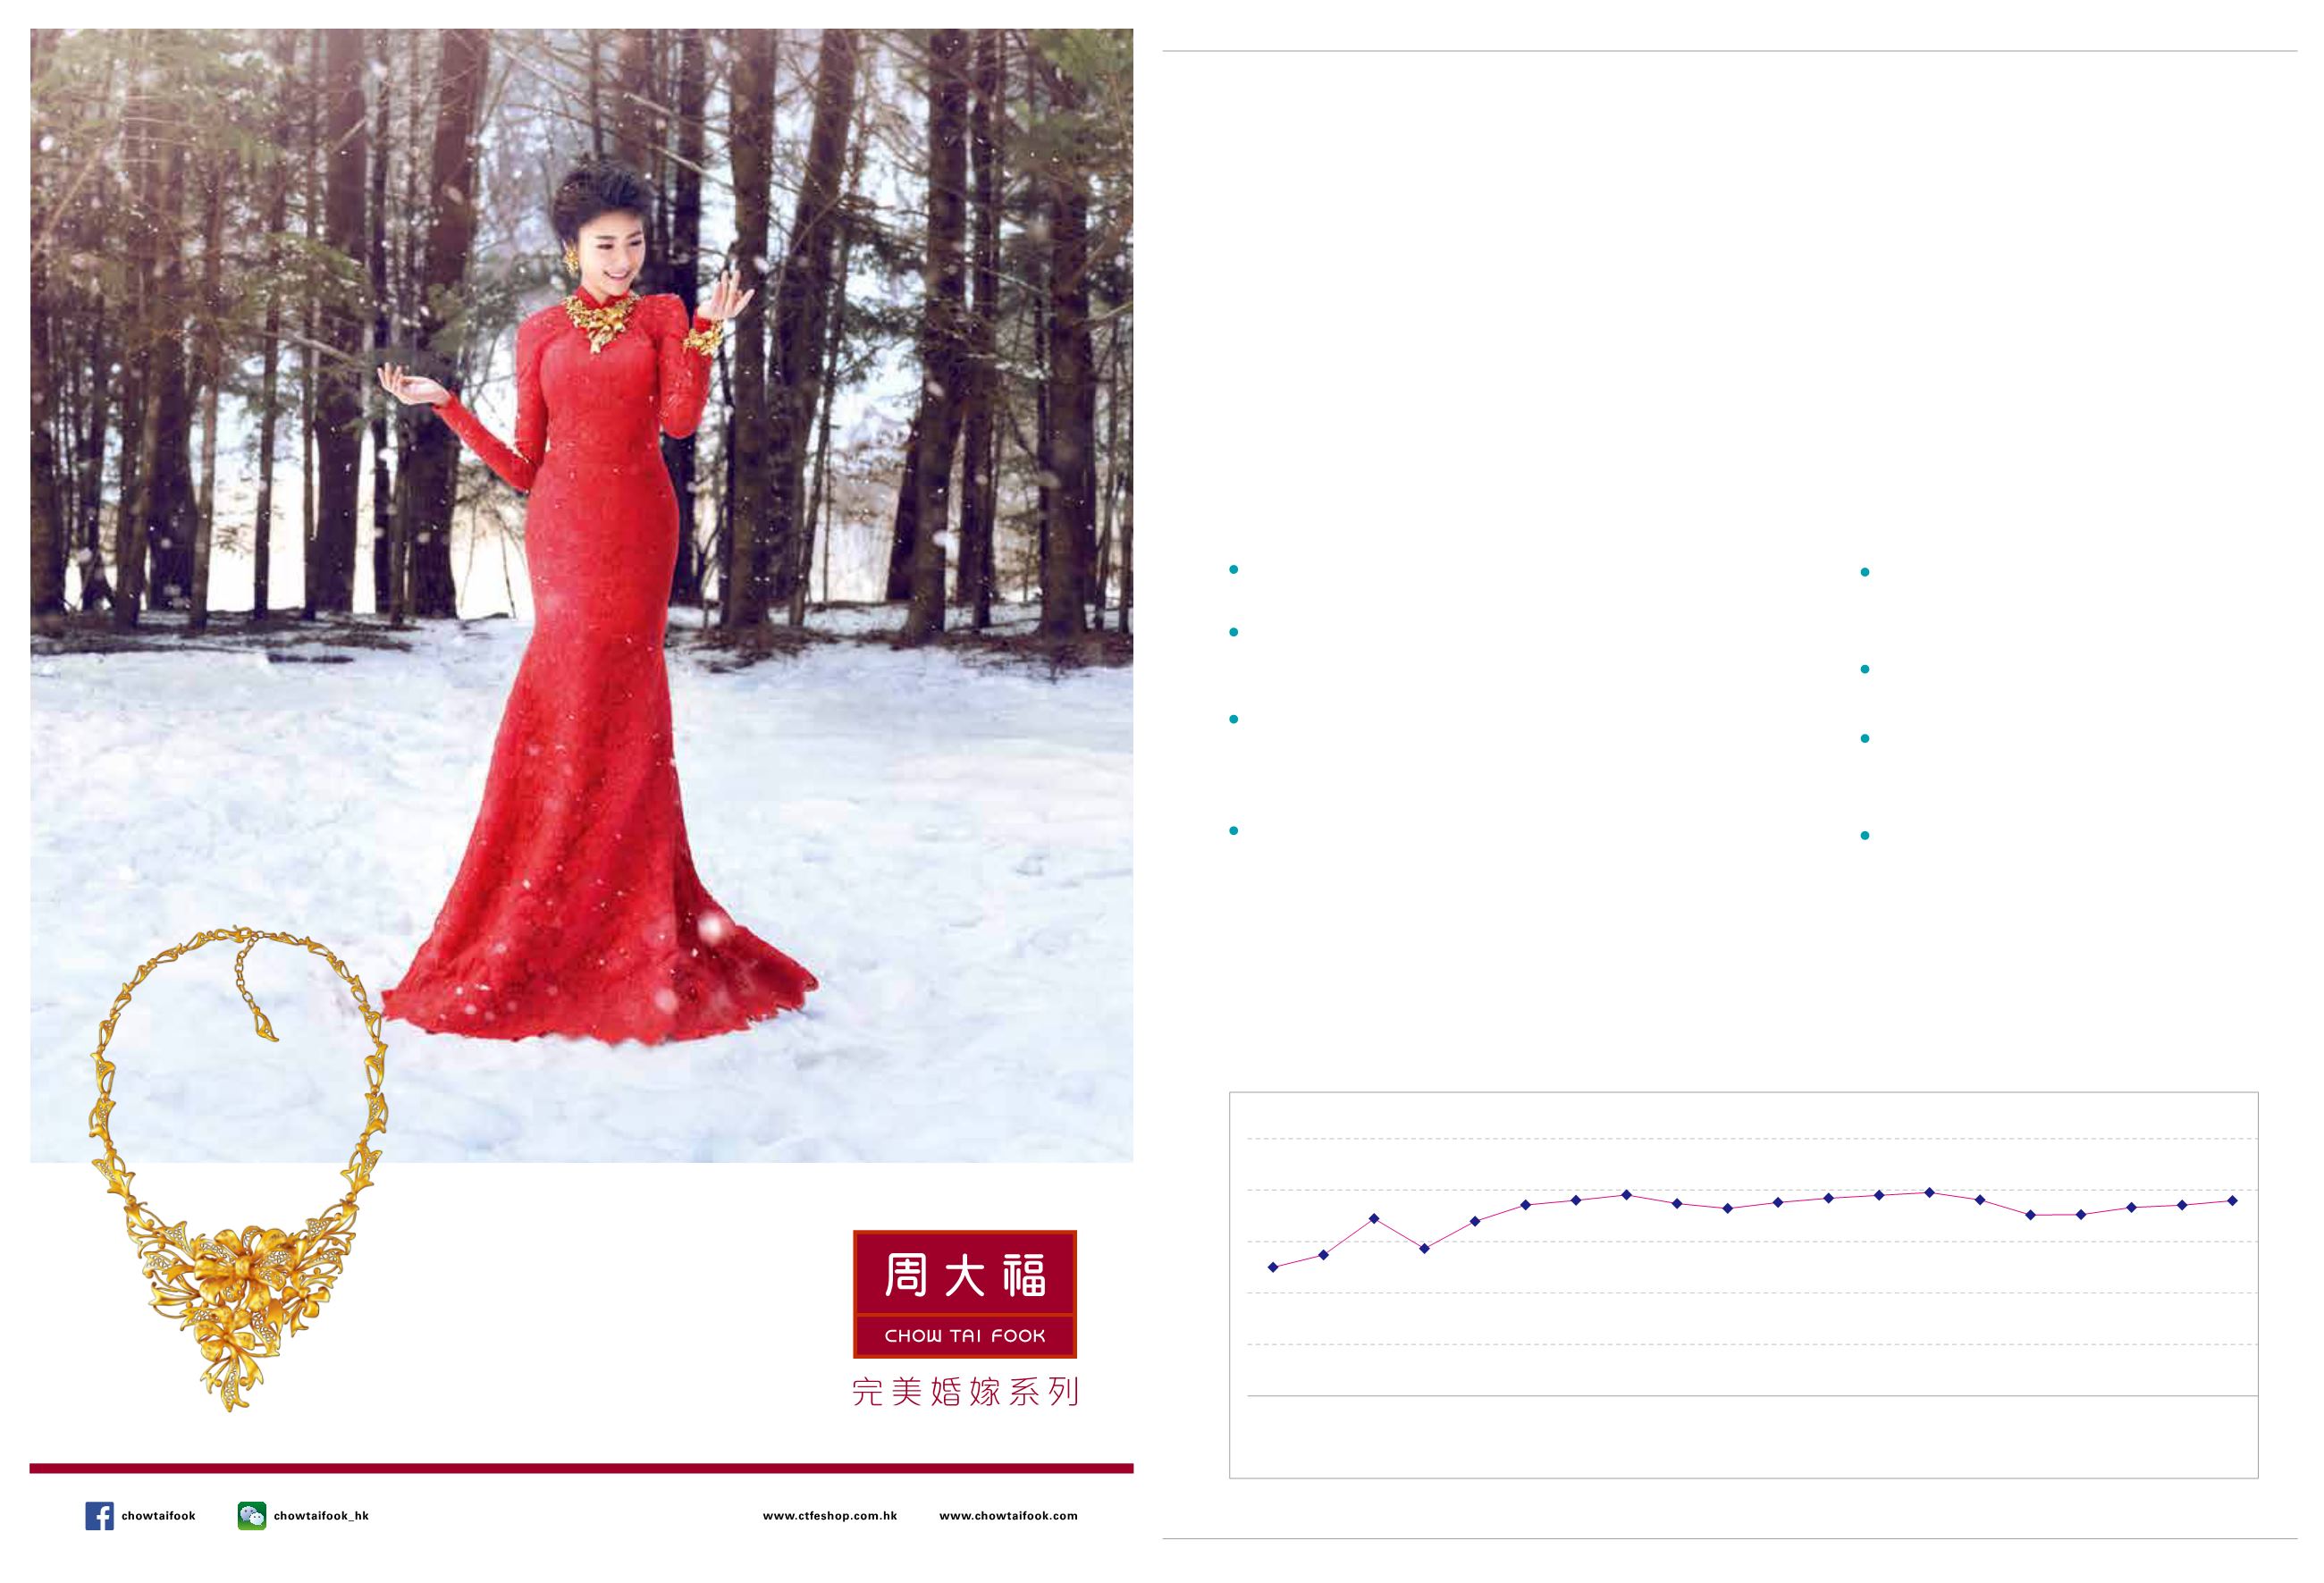
Retail Industry's Average Service Performance (from 1996 to 2015)
整體零售行業平均服務表現 (1996 - 2015)
Year
ԑӋ
[---------------------------------------------------------------------------------------------------------------------------------------------------------------------------------------> Growth
ቨ
ߝ
ġ
(1996-2015) 12.94%]
75.00%
77.41%
84.47%
78.64%
83.92%
87.12% 88.02% 89.06%
87.37% 86.43% 87.62% 88.44% 88.98% 89.53% 88.09%
85.17% 85.24% 86.64% 87.09% 87.94%
'96 '97 '98 '99 '00 '01 '02 '03 '04 '05 '06 '07 '08 '09 '10 '11 '12 '13 '14 '15
HKRMAMystery Shopper Programme -
2015 ServiceMonitor Index forRetail Industry
神秘顧客計劃 - 2015零售行業服務指數
The "Service Monitor Index for Retail Industry" was launched by the Association
in 1996. By analysing data from the Mystery Shopper Programme (MSP)
collected over the years, the Index shows the service performance of the industry
on a scale of 1-100% on a yearly basis. In 2015, the Index covered service
performance of 20 retail business categories including the newly-added category
of Specialty Stores – Underwear & Nightwear.
Latest Retail Service Trends
Over the past 19 years, the average service performance of the retail industry
has increased 13% from an index at 75% in 1996 to 87.94% in 2015.
When comparing the performance of the latest two years, the average
service performance of the industry in 2015 has increased 0.85% over
2014.
Among the 20 categories in 2015, a total of 13 categories performed
better than the industry’s average service performance index of 87.94%.
The Watch & Jewellery category showed the highest level of average
service performance with an index at 95.61% .
In 2015, 16 categories recorded an increase in their service performance.
Among them, Specialty Store recorded the highest increase of 5.15%,
followed by categories of Supermarket/Self-service Mega Stores (2.38%),
and Department Store (2.13%).
Highlights of service trends could be found on the Association's website
in "Policy & Industry Watch – Service Trend" section.
協會自
1996
年開始根據「神秘顧客計劃」所獲得的
資料數據,制定「零售行業服務指數」(指數)。
這項指數以
1
至
100%
作出評分,展示零售業每年的
服務表現。
2015
年的指數涵蓋了
20
個零售組別的服
務水平, 包括新增的專門店
-
內衣及家居服組別。
零售行業服務趨勢
零售行業的整體服務表現由
1996
年指數推出第一
期
75%
躍升至
2015
年的
87.94%
。過去
19
年來,
零售行業整體服務指數增加了
13%
。
與
2014
年相比,
2015
年的整體行業服務指數輕
微提升了
0.85%
。
在
2015
年,共有
13
個組別的服務指數都高過整體
行業服務指數的
87.94%
。其中鐘錶及珠寶店的服
務表現最佳,平均服務指數達
95.61%
。
在
2015
年,共有
16
個組別的服務表現均錄得
增長,其中最高升幅的是專門店組別,上升
5.15%
,其次是超級市場
/
大型自助購物商店組別
(2.38%)
,百貨公司組別
(2.13%)
。
有關服務趨勢的重點,請參與協會網站「法例
及零售資訊」中,「服務趨勢」一欄。網址:
2015 vs 2014:
0.85%
21


