|
Flagship Programmes
Flagship Programmes
|
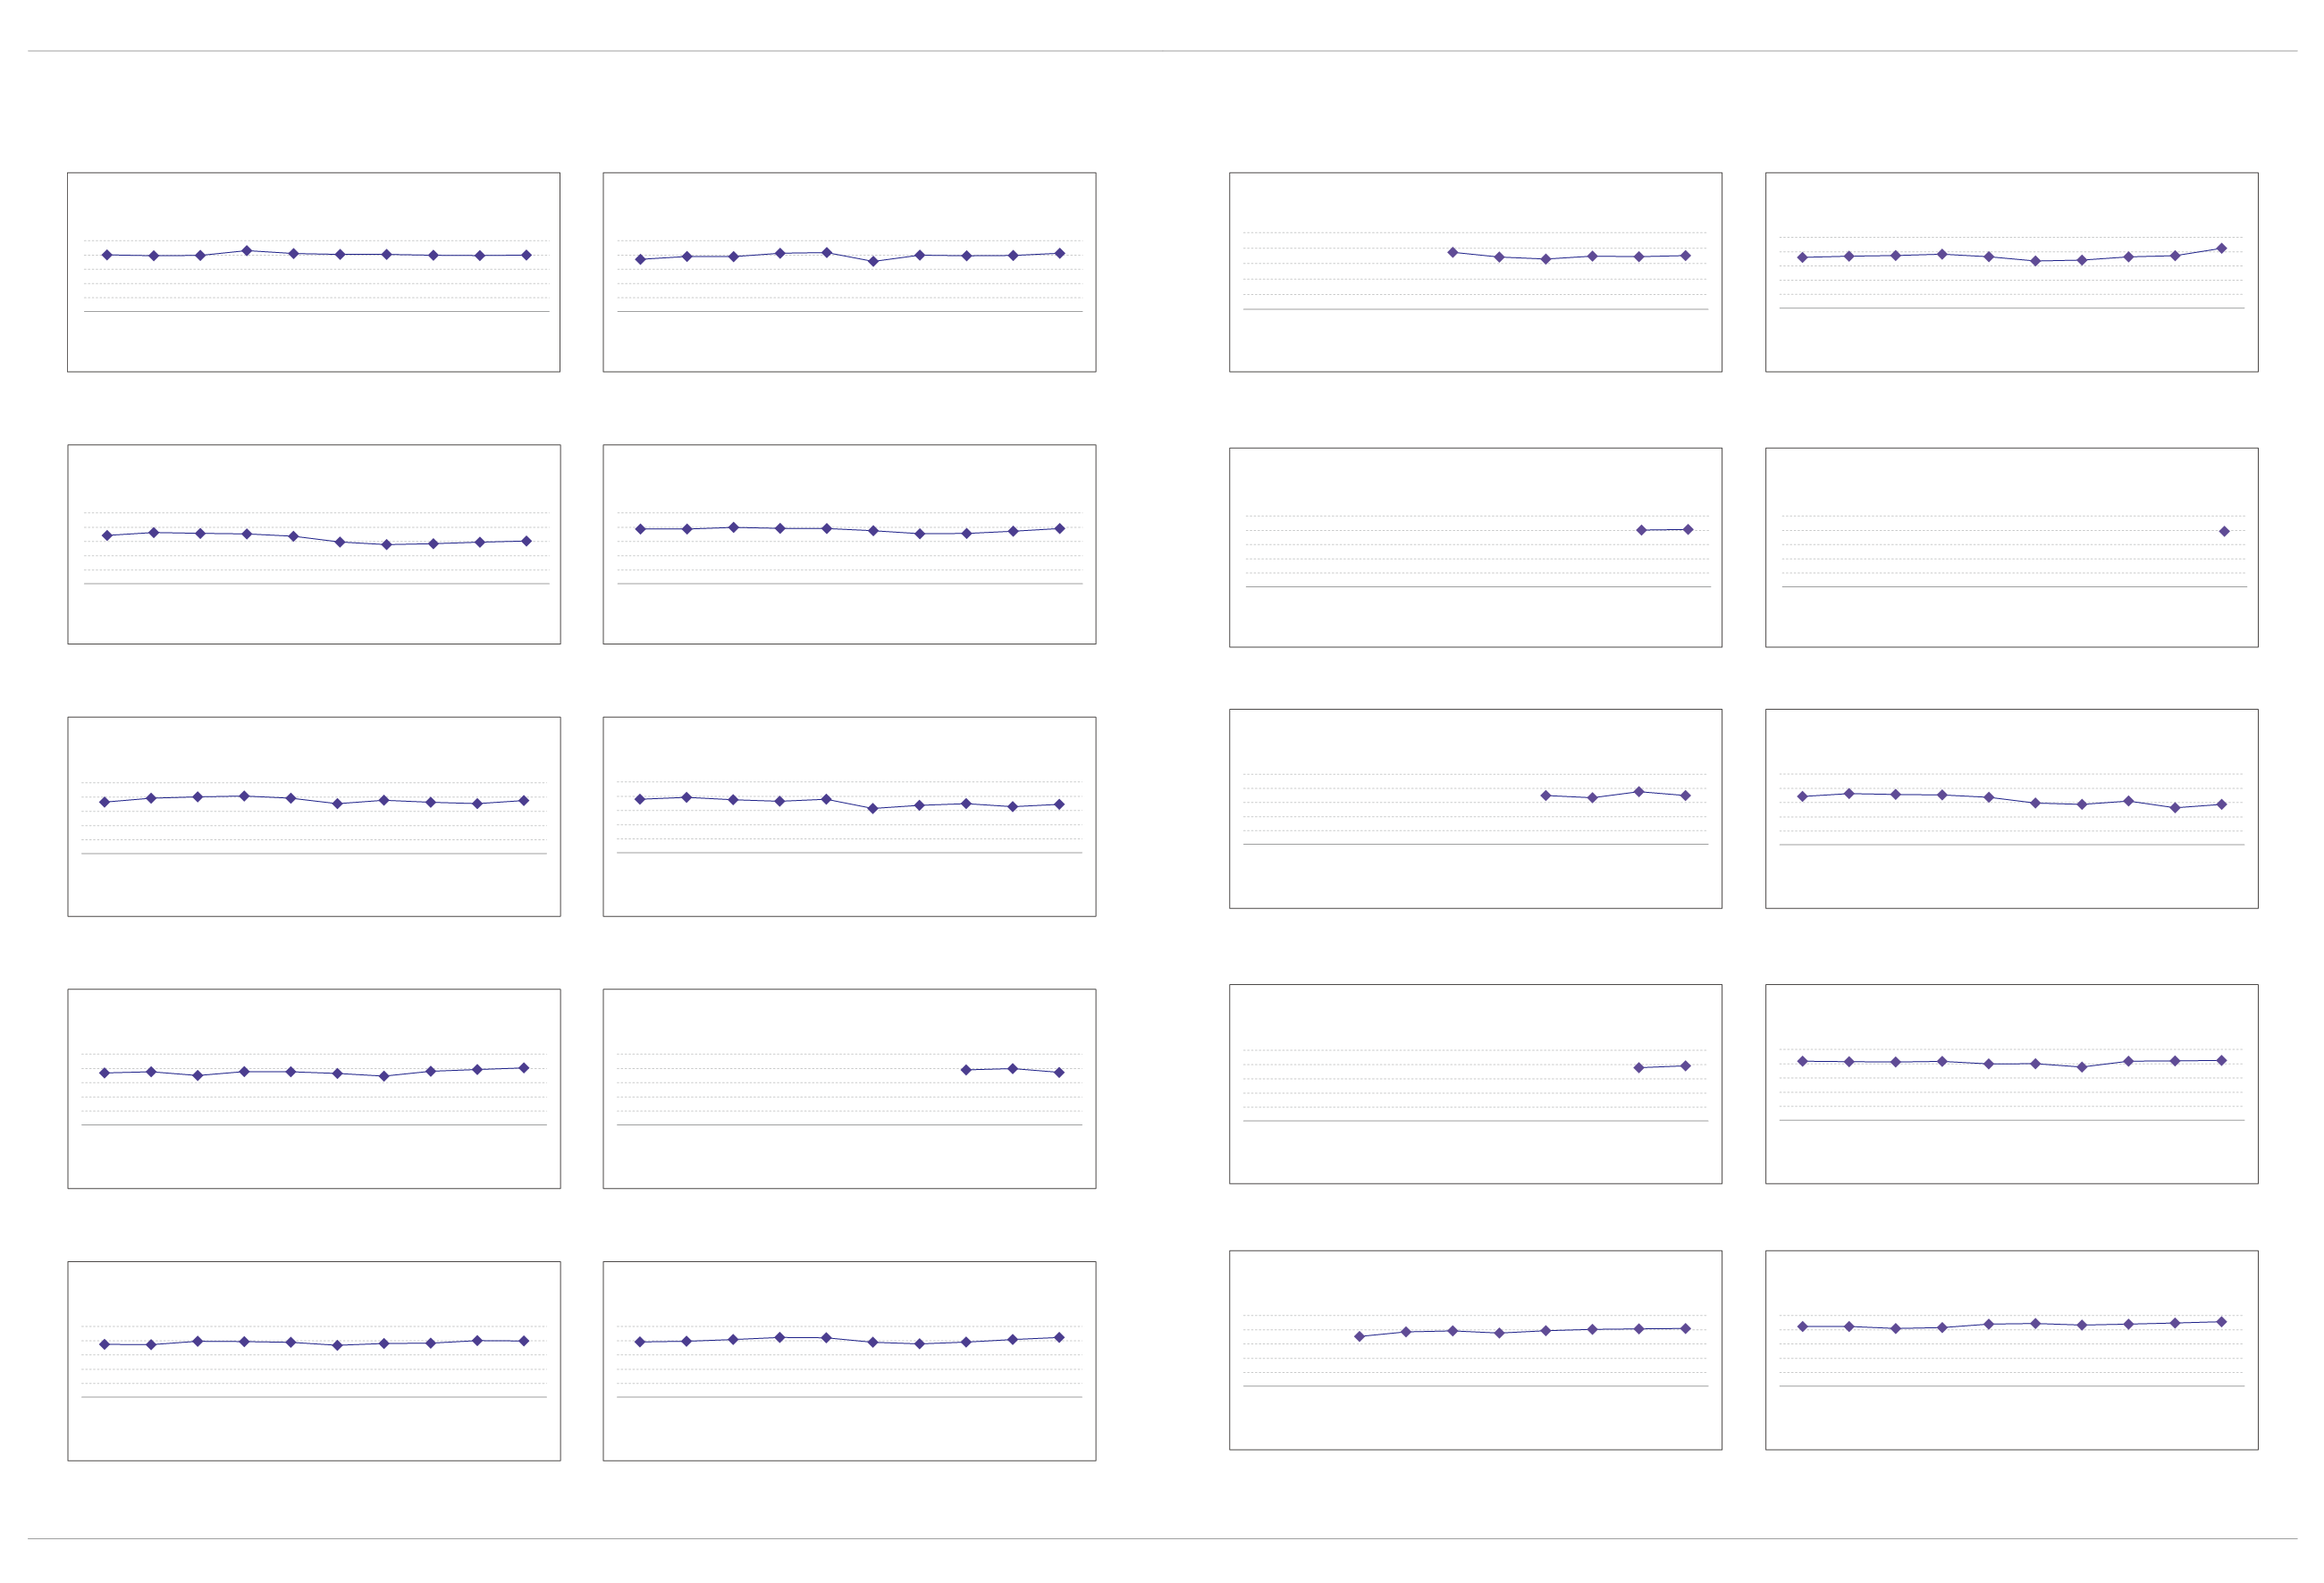
Average Service Performance of Individual Retail Category
各零售組別的平均服務表現
Year
ԑӋ
Fashion & Accessories – High Fashion Category
ࣛༀུ
ي
ֳ ৷ॴࣛༀଡ଼й
2014 vs 2013:
0.23%
2015 vs 2014:
1.58%
[-----------------------------------------------------------------------------------------------------------> 4.30%]
Beauty Products / Cosmetics Category
ʷ㛭ֳۜଡ଼й
2014 vs 2013:
-0.17%
2015 vs 2014:
0.28%
Year
ԑӋ
[----------------------------------------------------------------------------------------------------------> -0.17%]
06
07
08
09
10
11
12
13
14
15
Year
ԑӋ
Fashion & Accessories – Sports & Outdoor Products Category
ࣛༀུ
ي
ֳ ༶ਗʿ˒̮ۜ͜ଡ଼й
2014 vs 2013:
1.49%
2015 vs 2014:
1.98%
[-----------------------------------------------------------------------------------------------------------> 0.35%]
Year
ԑӋ
2014 vs 2013:
1.09%
2015 vs 2014:
0.78%
[----------------------------------------------------------------------------------------------------------> -3.96%]
Year
ԑӋ
Fastfood / Restaurants Category
Ҟֳ ᝂʿৢᅽଡ଼й
2014 vs 2013:
-2.14%
2015 vs 2014:
1.68%
Year
ԑӋ
Department Stores Category
ϵʮ̡ଡ଼й
2014 vs 2013:
-0.87%
2015 vs 2014:
2.13%
[-----------------------------------------------------------------------------------------------------------> 1.06%]
Year
ԑӋ
Food Shops Category
ֳۜଡ଼й
2014 vs 2013:
0.83%
2015 vs 2014:
-2.61%
[---------------> -1.78%]
Year
ԑӋ
Electronic & Electrical Appliances Category
ཥɿʿཥኜֳଡ଼й
2014 vs 2013:
1.26%
2015 vs 2014:
1.13%
[-----------------------------------------------------------------------------------------------------------> 3.56%]
Year
ԑӋ
Footwear Category
ቨᗳଡ଼й
2014 vs 2013:
1.76%
2015 vs 2014:
1.48%
Year
ԑӋ
Fashion & Accessories Category
ࣛༀུ
ي
ֳଡ଼й
2014 vs 2013:
1.83%
2015 vs 2014:
-0.32%
[-----------------------------------------------------------------------------------------------------------> 2.31%]
Convenience Stores Category
ک
лֳଡ଼й
90.12% 89.49% 89.80% 93.12% 91.08% 90.43% 90.48% 89.84% 89.67% 89.95%
84.16% 86.19% 85.58% 85.29% 83.57% 79.53% 77.68% 78.33% 79.42% 80.20%
86.44% 89.09% 90.04% 90.65% 89.12% 85.29% 87.70% 86.24% 85.37% 87.50%
86.73% 87.53% 84.91% 87.69% 87.56% 86.41% 84.48% 87.90% 89.16% 90.29%
87.37% 87.12% 89.49% 89.22% 88.80% 86.66% 87.92% 88.17% 90.00% 89.68%
86.87% 88.89% 88.81% 91.14% 91.65%
85.40%
89.84% 89.36% 89.59% 91.17%
88.72% 88.63% 89.80% 89.15% 89.02% 87.43% 85.37% 85.60% 87.09% 89.07%
[----------------------------------------------------------------------------------------------------------> -3.63%]
87.83% 89.14% 87.44% 86.39% 87.73%
81.28% 83.52% 84.66% 82.52% 84.20%
88.98% 89.81% 87.20%
[-----------------------------------------------------------------------------------------------------------> 3.15%]
89.02% 89.45% 90.79% 92.20% 91.92% 88.77% 87.68% 88.93% 90.69% 92.17%
06
07
08
09
10
11
12
13
14
15
06
07
08
09
10
11
12
13
14
15
06
07
08
09
10
11
12
13
14
15
06
07
08
09
10
11
12
13
14
15
06
07
08
09
10
11
12
13
14
15
06
07
08
09
10
11
12
13
14
15
06
07
08
09
10
11
12
13
14
15
06
07
08
09
10
11
12
13
14
15
06
07
08
09
10
11
12
13
14
15
Remark: This business category was set up in 2013.
ݧ
ཎĻġԪಢտܻijıljĴԑ೩ҳȄ
Year
ԑӋ
Furniture & Home Accessories Category
ࡆ௧
ʿ֢܃ۜ͜ଡ଼й
2014 vs 2013:
-0.44%
2015 vs 2014:
0.81%
[-------------------------------------------------------> -2.12%]
Year
ԑӋ
Specialty Stores Category
ਖ਼
ژ
ֳଡ଼й
2014 vs 2013:
0.92%
2015 vs 2014:
5.15%
[-----------------------------------------------------------------------------------------------------------> 6.34%]
06
07
08
09
10
11
12
13
14
15
06
07
08
09
10
11
12
13
14
15
87.25% 84.12% 82.83% 84.76% 84.32% 85.13%
85.96% 86.75% 87.26% 88.22% 86.41% 83.39% 83.99% 86.23% 87.15%
92.30%
Remarks: This business category was set up in 2010.
ݧ
ཎĻġԪಢտܻijıljıԑ೩ҳȄ
2015 vs 2014:
0.45%
Year
ԑӋ
Health Care Products Category
ੰପۜଡ଼й
Year
ԑӋ
Specialty Stores - Underwear & Nightwear Category
ਖ਼
ژ
ֳ lzВʿ֢ଡ଼й
06
07
08
09
10
11
12
13
14
15
06
07
08
09
10
11
12
13
14
15
90.12% 90.57%
[--> 0.45%]
89.20%
Remark: This business category was set up in 2014.
ݧ
ཎĻġԪಢտܻijıljĵԑ೩ҳȄ
Remark: This business category was set up in 2015.
ݧ
ཎĻġԪಢտܻijıljĶԑ೩ҳȄ
Year
ԑӋ
Infant & Child Merchandise Category
ᏃՅʿՅഁਠۜଡ଼й
2014 vs 2013:
4.34%
2015 vs 2014:
-2.79%
[------------------------------> 0.03%]
Year
ԑӋ
2014 vs 2013:
-4.81%
2015 vs 2014:
2.38%
Supermarkets / Self-services Mega Stores Category
൴ॴ̹ఙ ɽۨІпᒅ
ي
ਠֳଡ଼й
[----------------------------------------------------------------------------------------------------------> -5.59%]
06
07
08
09
10
11
12
13
14
15
06
07
08
09
10
11
12
13
14
15
84.78% 83.26% 87.60% 84.81%
84.16% 86.19% 85.58% 85.29% 83.56% 79.50% 78.59% 81.00%
76.19% 78.57%
Remark: This business category was set up in 2012.
ݧ
ཎĻġԪಢտܻijıljijԑ೩ҳȄ
Remarks: This business category has been renamed in 2013.
ݧ
ཎĻġԪಢտܻijıljĴԑΟಢտӪᆎȄ
2015 vs 2014:
1.28%
Year
ԑӋ
Personal Care Products Category
ࡈ
ɛᚐଣପۜଡ଼й
Year
ԑӋ
Telecommunications Category
ཥৃଡ଼й
2014 vs 2013:
0.24%
2015 vs 2014:
0.33%
[-----------------------------------------------------------------------------------------------------------> 0.59%]
[----> 1.28%]
06
07
08
09
10
11
12
13
14
15
06
07
08
09
10
11
12
13
14
15
87.73% 89.01%
91.65% 91.41% 91.15% 91.55% 89.81% 89.87% 87.59% 91.67% 91.91% 92.24%
Remark: This business category was set up in 2014.
ݧ
ཎĻġԪಢտܻijıljĵԑ೩ҳȄ
Year
ԑӋ
Retail (Services) Category
ཧਯ ਕ ଡ଼й
2014 vs 2013:
0.37%
2015 vs 2014:
0.23%
[---------------------------------------------------------------------------------> 5.67%]
Year
ԑӋ
Watch & Jewellery Category
ᙒ፶ʿमᘒֳଡ଼й
2014 vs 2013:
0.83%
2015 vs 2014:
0.91%
[-----------------------------------------------------------------------------------------------------------> 3.40%]
06
07
08
09
10
11
12
13
14
15
06
07
08
09
10
11
12
13
14
15
85.18% 88.42% 89.09% 87.62% 89.27% 90.25% 90.62% 90.85%
92.21% 92.22% 90.84% 91.48% 93.95% 94.39% 93.28% 93.87% 94.70% 95.61%
Remarks: This business category was set up in 2008.
ݧ
ཎĻġԪಢտܻijııĹԑ೩ҳȄ
23
22


